Facebook has just acquired the mobile messenger service WhatsApp for US$19 billion. Launched in 2009 by two former Yahoo employees, in just over four years WhatsApp has grown to 420m monthly users.
Why is it so popular? Founder Jan Koum told the New York Times in 2012, “We are providing a richness of experience and an intimacy of communication that e-mail and phone calls simply can’t compare with.”
Facebook has been pushing its own messenger service to its users, but without much success. Markos Zachariadis at Warwick Business School, said, “Facebook’s purchase of WhatsApp is in many ways an admission of defeat.”
The explosion in the number of smartphones in recent years has also seen a boom in instant messaging services. Popular services such as WeChat, Line and Viber each have more than 100m users. WhatsApp tops that chart in not just number of users but also engagement. With the per-day volume at 19 billion messages sent and 34 billion received, the messaging service will soon trump the total global SMS volume.
According to Sotirios Paroutis, also at Warwick Business School, Mark Zuckerberg is out to make Facebook a truly mobile company with Instagram and WhatsApp. “In the past WhatsApp founders have been vocal in their objection to be acquired by a larger firm. So beyond their own reward package, the promise to keep WhatsApp as an independent service seems to have helped bring the two parties together,” he said.
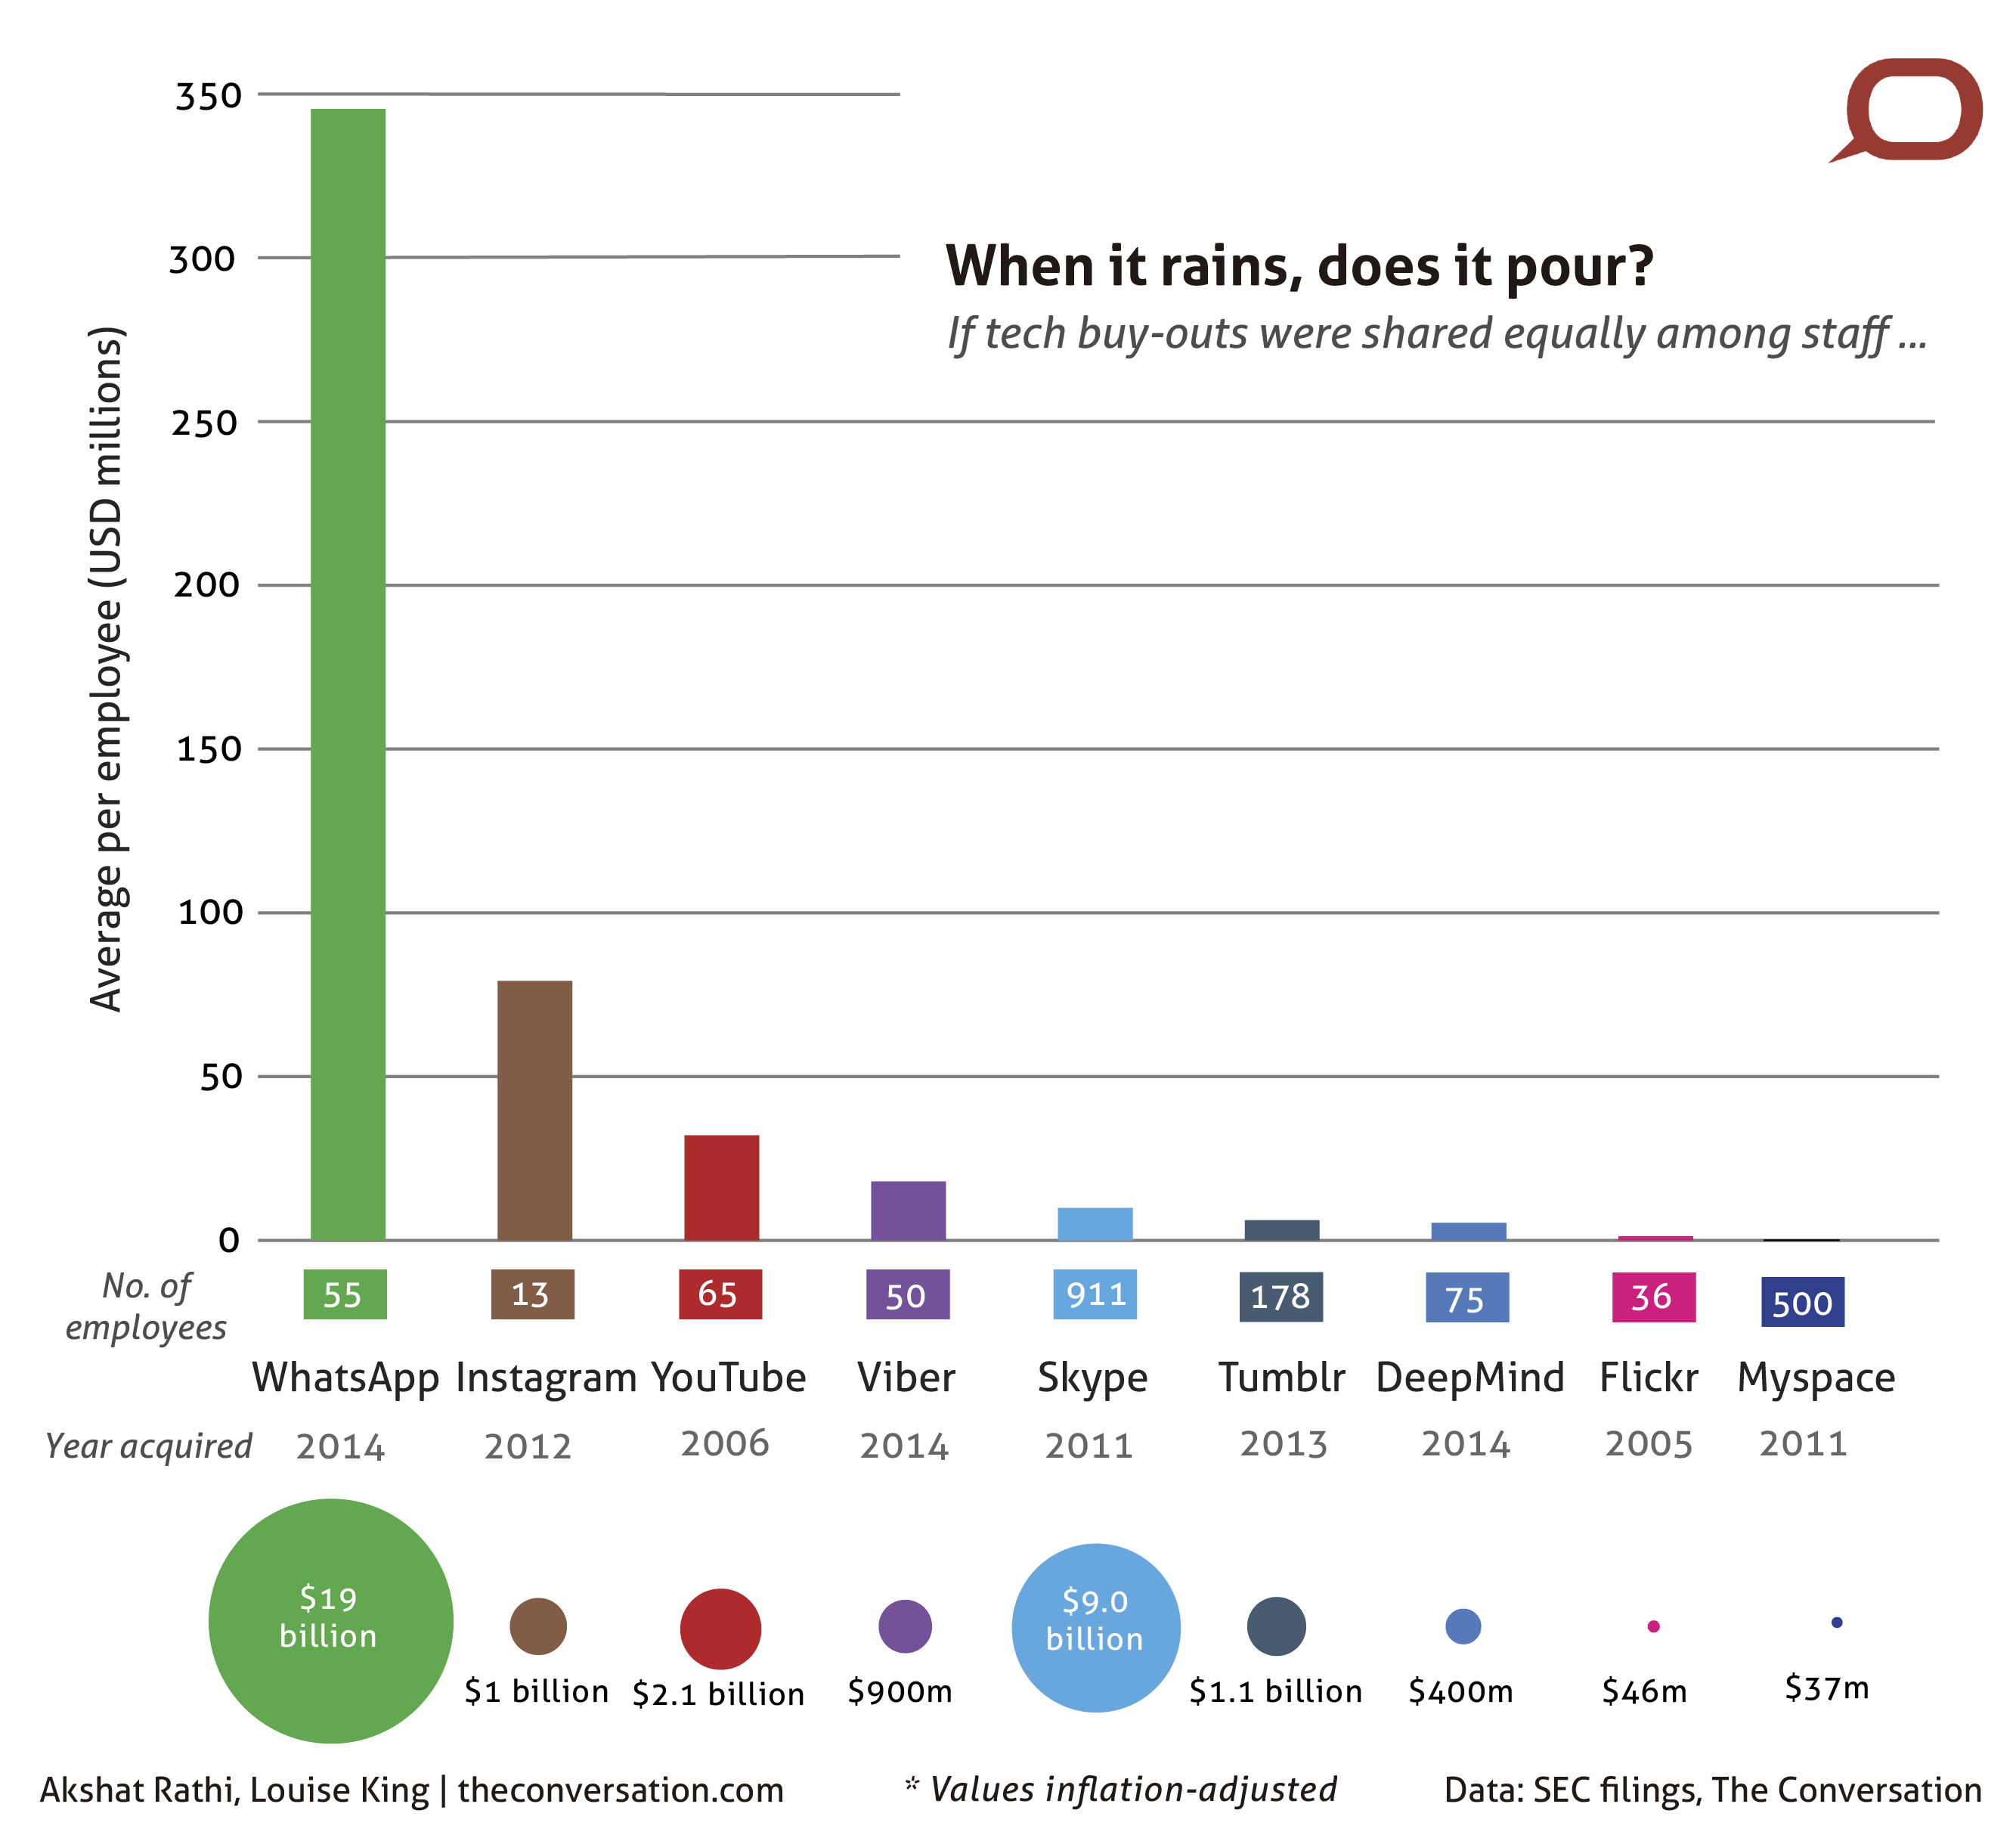
Show me the money
With only 55 employees, WhatsApp’s $19-billion valuation could, in an alternate universe where each employee was given an equal share, fetch US$350m per employee. This is nearly five times what employees of Instagram would have got when that company was bought out for US$1 billion in 2012.
While founders take away big chunks of the proceeds from such deals, with so few employees the windfall can still make many others rich. But in some cases, like that of Skype’s acquisition by Microsoft, the unequal distribution can leave employees with nothing. Worse still, Felix Salmon at Reuters points out that because of the way these deals are structured, employees can do little to fight back.
Nearly 400m people live in cities in India and during the next 40 years that number will more than double. Not only is the proportion of India’s total female population that is economically active among the lowest in the world, but urban areas do even worse. New analysis of data from the 2011 census shows only half as many urban women work as their rural counterparts.
Few states – including Iran, Pakistan and Saudi Arabia – do worse than India when it comes to women’s participation in the workforce. Others such as Somalia, Bahrain and Malaysia do much better. Among the BRICS (Brazil, Russia, India, China and South Africa) which are comparable emerging economies, India has the lowest female participation rate, with only 29% of women over the age of 15 working. As the chart below shows, even among the MINT countries – Mexico, Nigeria, Indonesia and Turkey – only Turkey has the same participation rate as India.
In mainly agricultural economies, urban women often find less work than rural ones. Half the working population in India is employed by the agricultural sector. But agriculture’s contribution to Indian economy has been steadily falling and is now less than half that of the services industry. This should have corresponded with rapid growth in numbers of working women in cities, but that hasn’t happened.
Economists have tried to understand this discrepancy. Some cite the problem to be India’s unemployment rate among the young, who make more than half of the population. But such joblessness should affect both men and women, and it also doesn’t explain the long-term trend of low women’s workforce participation rates. Others believe that younger people in cities are staying in education for longer. While that certainly contributes to the overall picture, it cannot explain the large difference between urban and rural figures.
Some discrepancy may arise because many women are involved in home-based work and are part of the informal sector, where their contribution tends to be under-reported. “Better enumeration will help, but measurement is not the only reason participation rates are so low in India, especially in urban areas,” Sher Verick, a senior fellow at the International Labour Organisation, said.
Patriarchy rules
According to Verick, the two main factors keeping women at home are social customs and very low education levels among women.
Breaking such customs is hard. Preet Rustagi, joint director of Institute for Human Development in Delhi, said: “To a certain extent, men control women’s lives. And women have internalised this as the norm. In such situations, the little work they do is the result of compulsion, such as when the household income is not enough, rather than choice.”
The power of social norms may be partially explained based on data from the city of Leicester in the UK, where one in four city-dwellers is of Indian background. According to a 2010 report by Sheffield Hallam University: “Economic activity rates among Indian women in Leicester are nine percentage points lower than for Indian women nationally.” In a large enough group of Indians, those social norms are more strongly held than when Indians are widely dispersed in the rest of the UK.
Although education levels have improved in recent decades, not as many educated women have found work.
“In India, there is a U-shaped relationship between education and participation of women in the workforce,” Verick said. “Illiterates participate more out of necessity. Women with a middle-level education (below graduate) have different aspirations and can afford to remain out of the workforce. Only better educated women have been ‘pulled’ into the labour force in response to better paid opportunities.”
Rustagi said a skills shortage among women is also to blame. “There is a large divide between what they can do and what jobs are on offer.” For instance, the lowest worker sex ratio is seen in construction, manufacturing and the retail trade, which are booming in cities.
The safety of women is also a concern in Indian cities, as was highlighted after the 2012 Delhi gang rape case. Better governance and improved policing ought to help, but urban India’s gender imbalance is a deeper cause for worry. The national average is 940 females per 1,000 males, but that drops to 912 for cities with a population larger than 1m. The imbalance is greater still in India’s biggest cities, with Delhi at 867 females per 1,000 males and Mumbai at 861.
The discrepancy in these figures may be partly explained by the mass migration of workers, mainly men, from rural to urban areas, according to Varsha Joshi, director of India’s census operations. But the drop is large enough that further investigation is needed to spot other reasons.
Empty promises
There are some positive signs. According to India’s National Sample Survey, the proportion of working women in urban areas has increased from 11.9% in 2001 to 15.4% in 2011. Rustagi said: “One of the fastest-growing sectors for urban working women has been domestic work. About 1.5m urban women were added to that sector in the last decade, which is more than one in ten jobs created for women in that time.”
But the areas that have shown the most significant growth, such as domestic work, tend to fall into the category of “informal” work – and under India’s labour laws, these workers have few workplace rights. This makes it harder for women to have sustainable jobs, let alone a career.
Indians go to the polls in April and, partly as a result of the focus of women’s issues, most parties have adopted promises about women’s empowerment as part of their campaigns, but none have spelt these promises out in any detail.
Immigrant students and those from poor backgrounds living in developed countries are being failed by the school system and face a high risk of marginalisation, according to a UNESCO report.
Data from the 2009 results of the OECD’s Programme for International Student Assessment (PISA) shows that only 60% of French 15-year-old students pass the minimum benchmark for reading if they are immigrants. This is the same proportion achieved by an average Mexican student. Non-immigrant students in France fare much better, with 82% achieving that benchmark.
Similarly, reading levels of England’s immigrant students’ are on par with an average student in Turkey, and Germany’s are on par with an average student in Chile.
According to Stephen Gorard, professor of education and public policy at Durham University, “On average economic migrants and refugees from less educated social backgrounds may tend to do worse, wherever they go.” He said that when UNESCO quotes difference in attainment rates for immigrants in different countries, “it is important to bear in mind how developed these countries are and where the influx is from.”
This comparison between immigrants and non-immigrants may mask issues over first-generation immigrants studying in a second language. Gorard said factors of social class are of key importance. Where new children perform worse at school than their indigenous peers, “this is not necessarily a consequence of their immigrant status of their treatment by others.”
The key question is what happens over time, perhaps over a generation or two. But, he said, “This is in no way an excuse for situations where there is direct evidence of unfair treatment of recent immigrant students.”
Their analysis found that in England, the gap between rich and poor children achieving minimum levels in maths grows as they progress through school. At grade four (nine-year-olds), the gap was 8%, but it was 19% by grade eight (13-year-olds).
New Zealand has similar disparities, with only two thirds of poor students achieving standards, compared to nearly all rich students. In Australia, the problem has persisted for more than a decade, with two-thirds of indigenous grade 8 students achieving the minimum level in maths between 1994-5 and 2011, compared to 90% of non-indigenous students.
Such discrepancies are not inevitable. Policies in East Asian countries such as Japan and Korea, as well as in Finland, have promoted quality teaching and helped level reduce disparities in learning, creating a level playing field for students from different social class.
Policy interventions to address discrepancies between ethnic groups can be difficult to get political attention. When it comes to analysis of achievement of different ethnic groups, David Gilborn, professor of critical race studies at the University of Birmingham, said race equality isn’t currently taken very seriously in debates around education in the UK. “I think certainly over the last few years, policymakers have not just taken their eye off the ball in terms of inclusive education. They’ve removed it from the agenda all together.”
Gilborn has worked on the differences in attainment between children of black Caribbean heritage, and the national average, which he said remain pronounced. “Education policy at the moment is dominated by a kind of colour blind rhetoric that emphasises standards and choice, and if anything, talk about inclusion and social justice tends to emphasise a particular view of white students being the race victims,” he said.
The UNESCO report points out that 250m of the world’s 650m primary school-age children are not learning the basics of reading and maths. The researchers put the cost of this to governments at $129bn, or 10% of global spending on primary education.
Bearing the price in mind and the fact that many of the children going through the school system are not actually achieving basic levels in reading and maths, it is possible to break down the cost-efficiency of spending on primary education. For example, in Burundi, the average spend per pupil is $60. But if you remove those who are not learning the basics, and the cost per pupil is $204.