Why there may be fewer truly new drugs hitting the market

Developing new drugs is hard and expensive. The lengthy process from initial discovery to the market is some times compared to the difficulty of putting a person on the moon. Despite accusations that the pharma industry is evil, the real reason could be summarised pithily in what one scientist said: “Drugs are expensive because we are stupid.”

Even after studying some diseases for more than 100 years, we are not close to understanding them well enough. With so many unknown factors at play, the fact that we are able to still find relatively simple chemicals to effectively act as drugs is pretty amazing.

But with much initial success, the productivity of the pharma industry has been falling for many decades. According to John LaMattina, former president of global research and development at Pfizer, “30 is the new 50” in the drug industry. He is referring to the number of new drugs approved per year, which has been on average declining since the 1960s. This is happening at the same time as research and development (R&D) costs are going up.

Drugs4-01

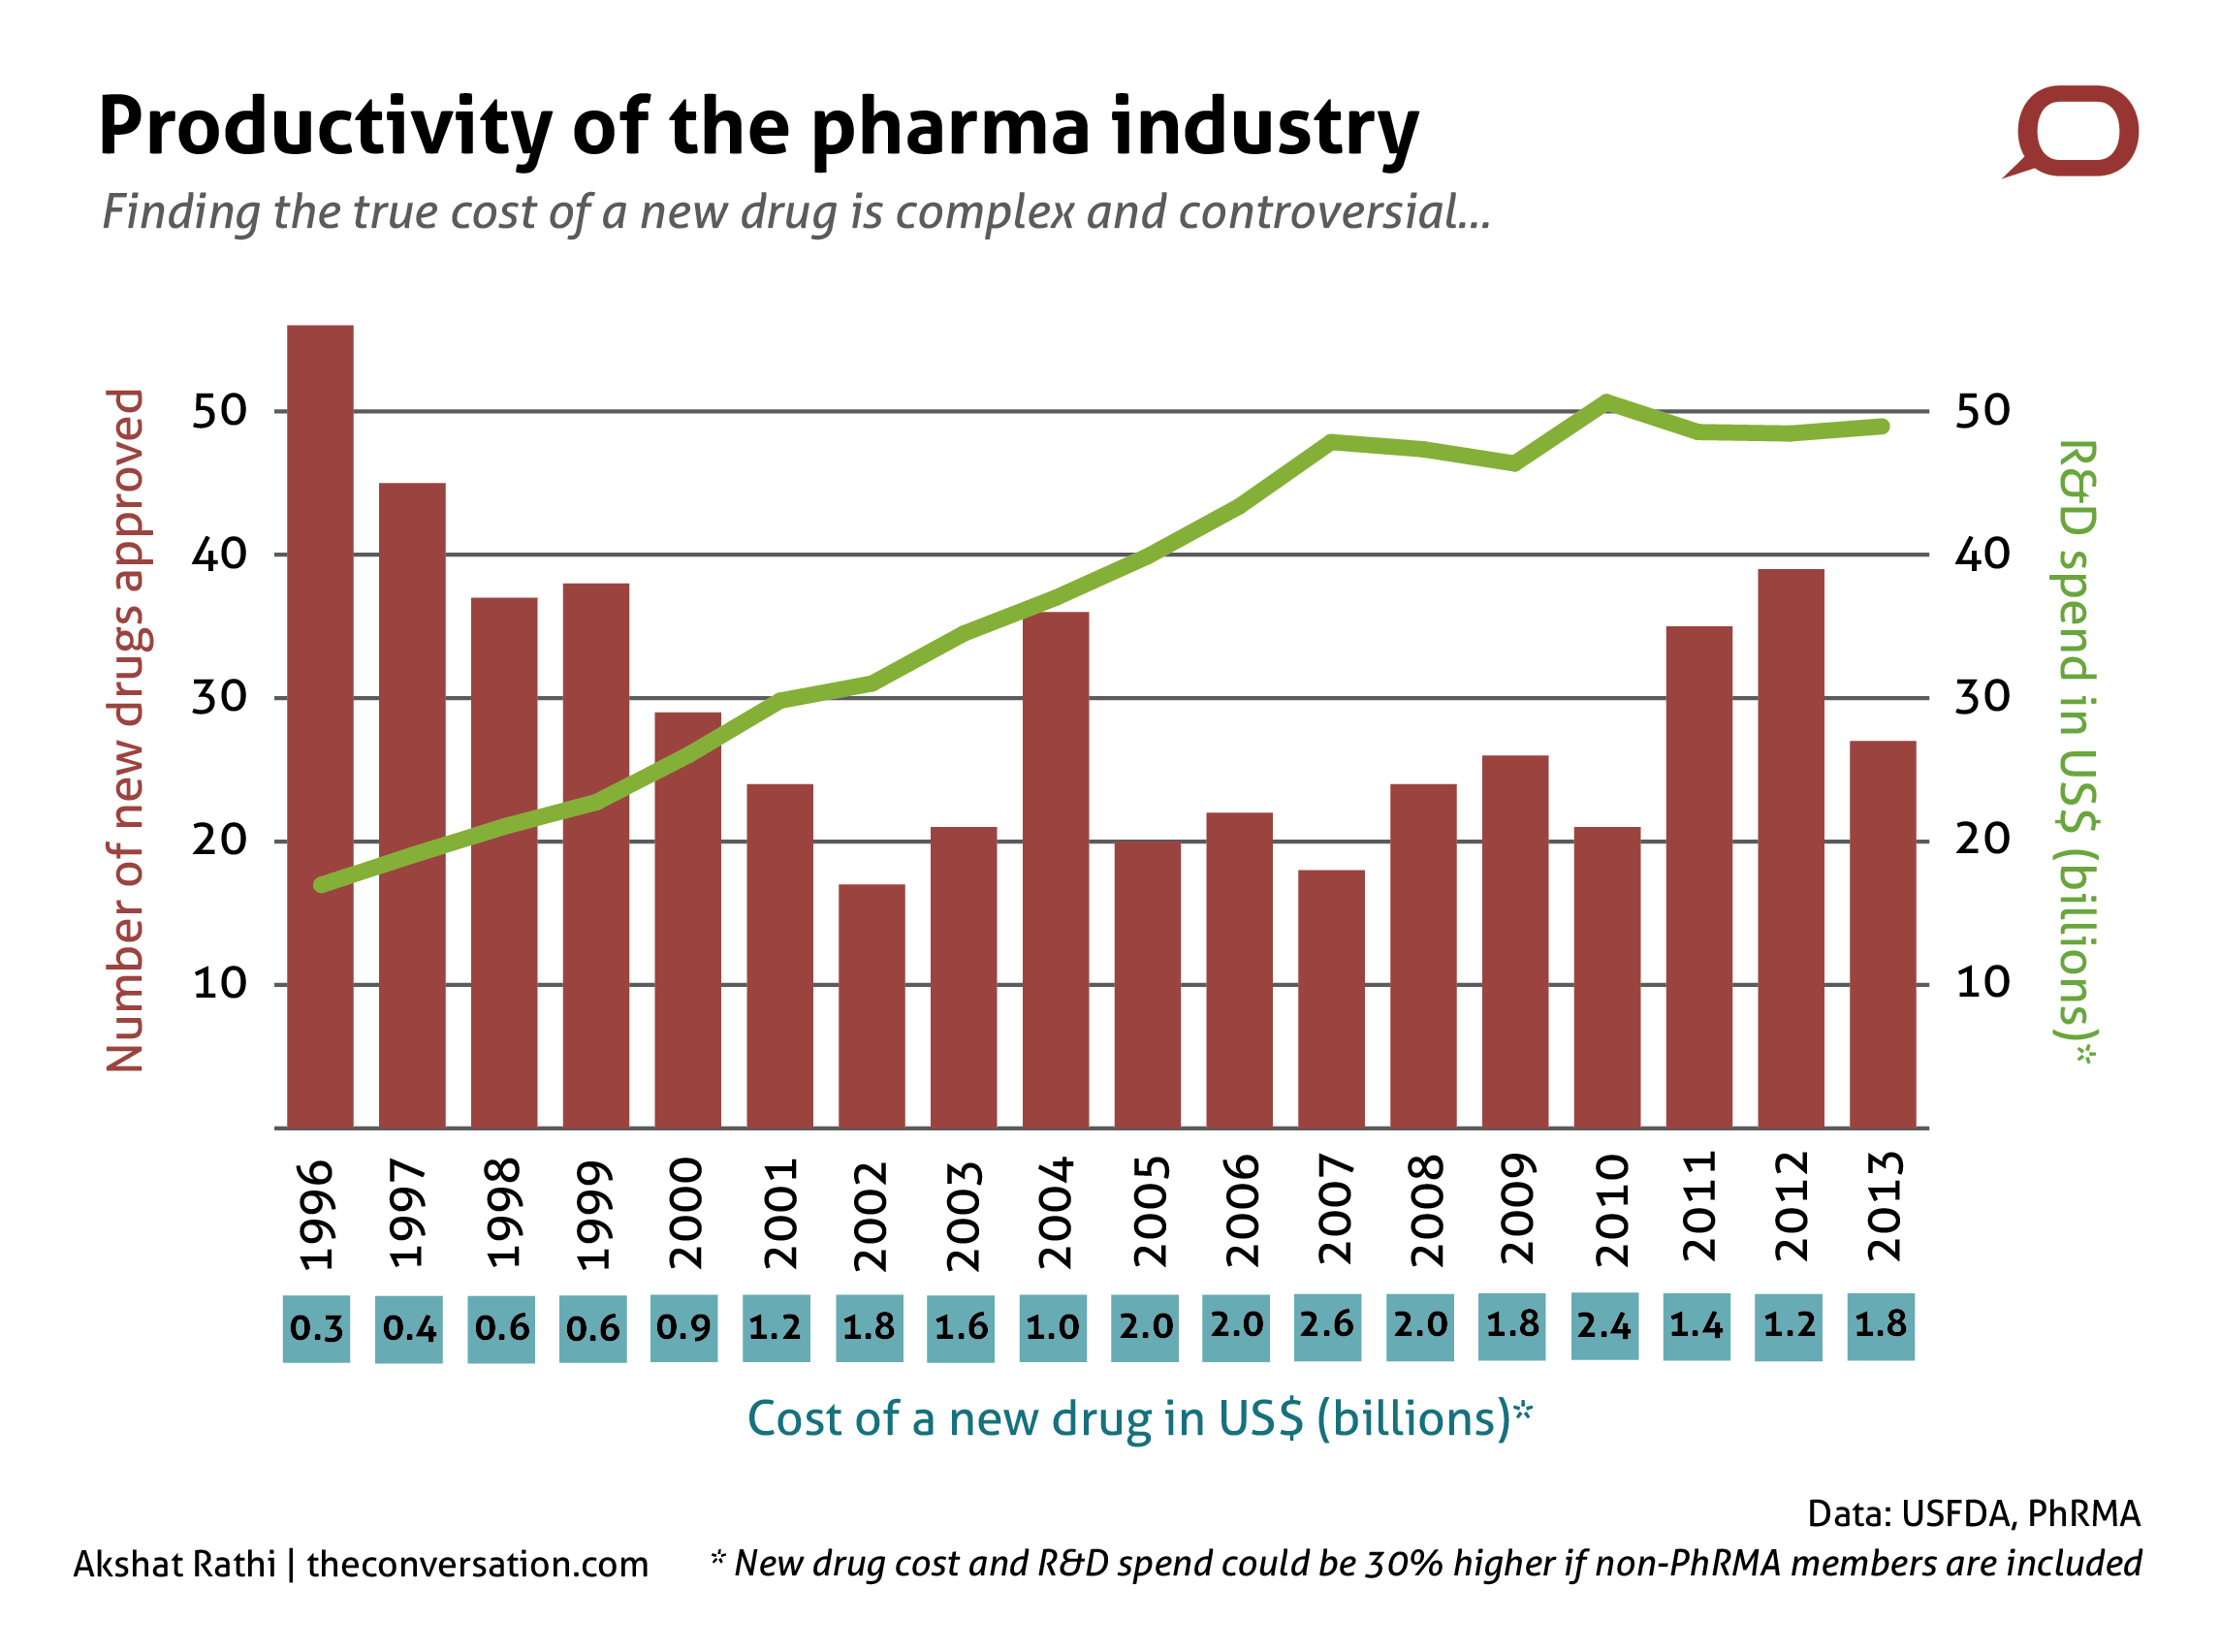
Finding the true cost of a new drug is a complex and controversial exercise. However, one acceptable way to calculate it is to divide total R&D spend of pharma companies by the number of new drugs produced. Because of differences in agreeing what constitutes R&D spend, even this measure produces only a range – the cost of a new drug is somewhere between US$1 billion and US$5 billion.

However, many argue that simply looking at the rising costs does not give the true measure of the pharma industry’s productivity. New drugs don’t always mean effective new treatments. According to new studies just published in the Journal of the American Medical Association (JAMA), Efthimios Parasidis of Ohio State University writes on The Conversation that nearly half of the new drugs between 2005 and 2011 received an approval without the drug company needing to show that those drugs had any tangible benefit to a patient.

With rising costs and fewer new drugs, the pharma industry could do with a boost in the arm. That, however, seems to be a hard find.The Conversation

First published on The Conversation.

Ten tiny places that have their own domain names

Claiming to be a country is an easy task. But to make others accept your claim is a lot harder. Aspiring states need favours from great powers, or sometimes even celebrities, to establish their legitimacy. In the digital age, this starts with wanting a top-level domain name, such as the “.in” suffix for India.

The Scottish National Party, which is rooting for Scotland’s separation from the UK in a referendum to be held this year, launched a campaign in 2008 to get Scotland its own top-level domain name. After five years, the International Corporation for Assigned Names and Numbers (ICANN), a consortium that controls these suffixes, agreed to setup the “.scot” suffix.

As Nina Caspersen, who studies the politics of unrecognised states at the University of York, wrote on The Conversation this week, states such as Somaliland and Transnistria start by setting up websites where they claim to be “independent and democratic”. However, with websites ending in “.com” or “.org”, respectively, their claims look weak.

These countries would have had better luck had they been dependent regions to start with, because ICANN assigns domain names to dependent regions if they apply. That is why, although there are the 206 sovereign states (of which 11 are not recognised by the United Nations), there are 255 country-code domain names.

This can go too far. For example, Heard and McDonald Islands, a dependency of Australia in the Indian Ocean, has its own top-level domain name, “.hm”, even though its population is zero, and its official website uses Antarctica’s top-level domain name, “.aq”. And it’s not alone.

Here is a list of the ten least populated regions with their own top-level domain name:

Bar chart-01

First published at The Conversation.The Conversation

Visualising Facebook

Your correspondent was shocked to learn that 34% of his Facebook friends are married. Still in his 20s, he does not want to contemplate settling down quite yet. Knowing that 64% of his online friends are male does not help either—more so because only 57% of Facebook is comprised of women. When he lamented these facts (on Facebook of course) he was asked the obvious question: “Did you go through your friends list and count?”

Well, no. The number-crunching comes courtesy of Wolfram|Alpha, a sort of search engine for quantifiable facts. Begun in 2009 by Stephen Wolfram, a British scientist and entrepreneur, the online service serves up answers to queries by harnessing information from its own databases. It can compute things like the distance between the Earth and the Moon on your parents’ first Valentine dinner, for example. Its latest feature lets people analyse their Facebook account for free. Enumerating and plotting the vagaries of one’s online life is at times surprising. Your correspondent wouldn’t have thought he was many times more active in 2011 than this year, in terms of status updates, sharing links, photos, etc (chart below).

Since the service began a few weeks ago, more than 400,000 Facebook users have let Wolfram|Alpha examine their digital bits—an outpouring of interest that caught the firm by surprise, says Luc Barthelet, Wolfram|Alpha’s executive director. The company plans to expand into other “personal analytics” services. Mr Barthelet declined to be more specific, but it could well entail analysing users’ email patterns and other social media behaviour.

In February Wolfram|Alpha rolled out a Pro service. At $4.99 per month it gives people the ability to process their own data, or even download Wolfram|Alpha’s information on a query. Such information is potentially very useful as it comes from the service’s own curated databases. Thus, armed with data on homicides in African countries, for example, Wolfram|Alpha can generate various types of graphs (scatter plot, raw data plots, bivariate histograms) to help users understand their information better. It can create a heat map to visualise the data geographically. And it lets users overlay other data, such as GDP of the country, to make, in this case, a GDP-neutralised heat map.

The Wolfram|Alpha “answer engine” is based on Mathematica, a software program developed by Mr Wolfram that can perform elaborate calculations. After the site’s launch in 2009 it was criticised for being limited in what it could do: solve mathematical problems, answer some scientific questions, but nothing out of the ordinary. Since then it has expanded considerably. As it moves beyond computing the world into analysing the individual, it is providing fresh new ways to look at life.

Also published on economist.com.

Free image from here.