Governments around the world are pushing to get their citizens to cycle more. Without necessary infrastructure, however, that is not good news for pedestrians or cyclists.
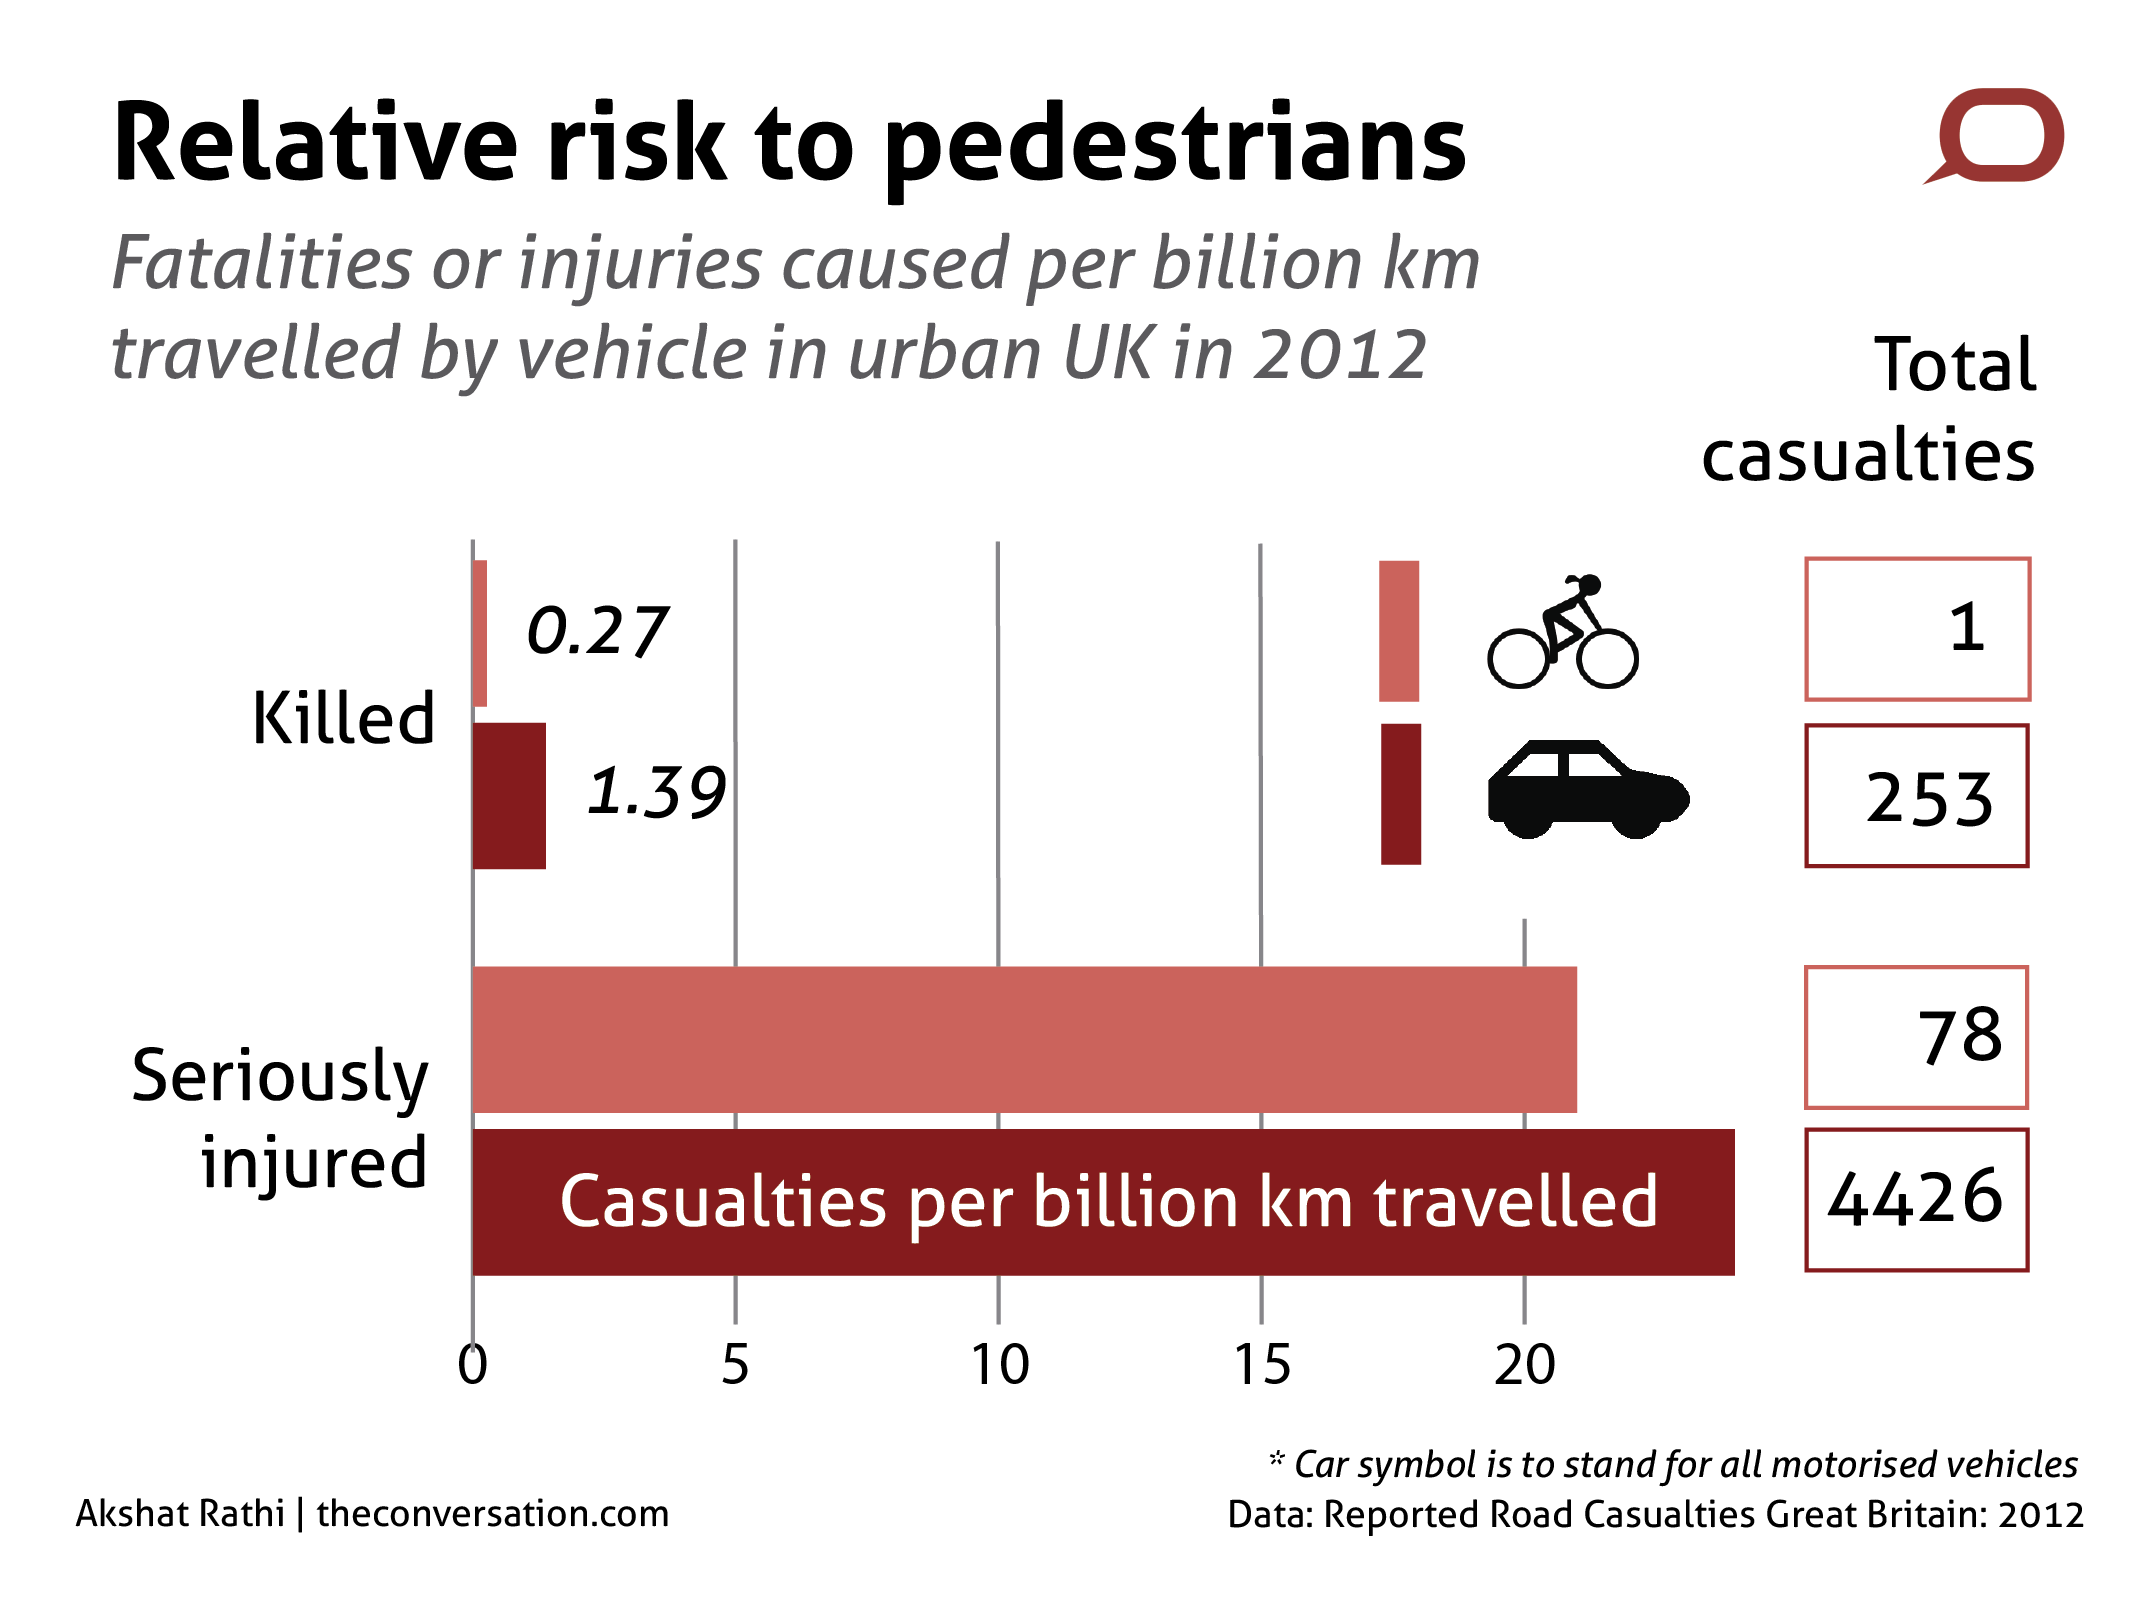
While on an evening stroll, no one likes a bike whizzing past on the same footpath. Many pedestrians worry about getting injured by cycles more than by cars, and their perception of risk in this case is not much off the mark. Data reveals that cyclists are nearly as likely to cause a serious injury to a pedestrian as motorists are—if you are a British pedestrian, that is.
The absolute number of people hurt by cyclists is quite small, but so is the corresponding distance travelled by cyclists. Thus the relative risk from cyclists and motorists is comparable.
According to the British government’s data, between 2003 and 2012, cyclists killed 23 pedestrians and injured 585, whereas motorists killed 4,894 and injured 45,496. But in 2012, motorists cover as much as 50 times the distance in urban areas as cyclists do. Using corresponding casualties data, the relative risk from motorists to pedestrians is five times as much as that from cyclists if the injury leads to death, but the risk of seriously injuring a pedestrian is about the same.
The data is comparable to that acquired from Transport for London (TfL), the city’s authority for all matters vehicular, through a freedom of information request by the National Cycling Charity. The request was to find out how much cyclists hurt pedestrians on footways only. (In legalese footway is one that runs alongside a carriageway, whereas a footpath is located away from it.)
In the period from 1998 to 2007, cyclists killed none and caused some injury to 98 pedestrians on footways in London. For motorists, the corresponding numbers were 54 and 4,460. If the distance travelled by motorists is assumed to be about 50 times that of cyclists, like the 2012 national average, the relative risk of causing some injury to pedestrians is nearly the same from cyclists as it is from motorists.
However, John Parkin, professor of transport engineering at the University of West England, said, “Provisions for cyclists are so appalling that it is not surprising some find it easier and safer on the footway. If cyclists need to go on pedestrian routes, then the government needs to provide better infrastructure.”
According to Parkin, the last decade has seen improvement in cycling infrastructure, at least in cities like London, but much remains to be done.
One solution being backed by Network Rail, operator of most British rail infrastructure, and TfL is the development of SkyCycle—a 220km car-free route installed above London’s suburban rail network. But, as Steven Fleming and Angelina Russo write on The Conversation, cyclists are not too pleased with this initiative. For the price tag of £220m, many argue there are cheaper ways to improve matters. But more worrying is the fact that SkyCycle may mean that the streets will be given over to the car, which in some places is already a problem.
Compared to the rest of Europe, the UK has among the smallest proportion of people using cycles as their main means of transport. Only about two in 100 Britons fall in that category, which is marginally better than Bulgaria, Malta and Cyprus.
Politicians want to change that. An all-party inquiry is considering how best to get Britons cycling. Hopefully they will heed the advice of not just cyclists but also pedestrians.![]()
First published at The Conversation.